

Value Chain Emissions Management
Carbon Reduction Commitments and Policies
AUO began auditing the GHG emissions of our global manufacturing sites in 2003, and the ISO14064 standard was introduced to disclose emissions-related information through external verification. We developed a digital platform internally in 2010 to systematically manage the organization‘s GHG emissions as a means to managing long-term operational carbon reductions.

Innovative Low-carbon Production
- Progressive reduction of F-Gas
- F-GHG volume reduction
- Ecological benefits indicator management
Achievement
- All factories have installed L / S.
- Reduce the emission of high GWP fluorinated greenhouse gases (F-GHG) with an efficacy of more than 99%.

Greater Energy Efficiency
- Energy conservation efficacy verification
- Smart energy monitoring and control
Achievement
- More than 1200 energy management proposals in 2024.
- The annual electricity saving rate is 4.72%.

Promote Renewable Energy
- Power from renewable energy
- Green certifications
Achievement
- Taiwan's self-use renewable energy in 2024: 139.76 MWh
- Taiwan's CPPA green energy supply in 2024: 100,907 MWh
- China's self-use renewable energy in 2024: 62,526.59 MWh
- China's CPPA green energy supply in 2024: 97,908.35 MWh
- China's G-REC purchase in 2024: 30,000 MWh

Innovative Low-carbon Production
Greater Energy Efficiency
Promote Renewable Energy
Energy-saving training
Energy efficiency training provided to employees to raise awareness of energy consumption reduction.

Innovative Low-carbon Production
Scope 1 and 2 targets of AUO follow the SBT 1.5°C warming scenario, with an absolute reduction of 42% in carbon emissions by 2030, using 2021 as the base year. In this pathway, the targets for Scope 1 in 2024 are set at 69,200 tons of carbon equivalent, while for Scope 2, it is 2,493,300 tons of carbon equivalent.
Unit:tonnes CO2e
Achievement
Full implementation of F-GHG management (scope1)
Reduction of fluorine-based gas emissions(F-GHG), with high greenhouse gas emission potential in the process, reaching destruction removal efficiency over 99%
Accumulated reductions and Emissions per unit area in PFCs
Greater Energy Efficiency
Energy use and power saving goals
Unit:100 million degrees
Achievement
Continuous improvement of energy management (Scope2)
More than 1,000 energy management programs every year, exceeding the target annual energy-saving rate 1.5%.
AUO energy-saving effectiveness over the years
The power saving plans including actual investment and management actions contributed power saving rate over 1.5%.
Unit:ten thousand kWh
Unit:Cases & %
Promote Renewable Energy
- Power from renewable energy
- Green certifications
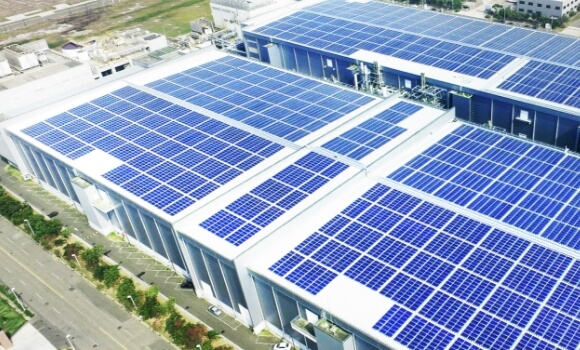
Rooftop Solar Power Plants in Taiwan factories
- The installations of the solar power plants in all sites in Taiwan achieved a total installed capacity of nearly 42 MW.
- The first TFT-LCD manufacturing company in Taiwan to obtain renewable energy certificates.

Total installation
42 MW
Area
18.5 hectares
(25.8 football fields)
Power generation
146650 kWh / day
Electricity supply
14665 households / day
GHG Reduction
28248 tones CO2e / Year
(72.6 CO2 absorption of Daan Forest Park in one year)
Energy-saving training
AUO plans basic energy-saving education and training, starting from understanding the distance between us and net-zero, allowing colleagues in production and manufacturing units to clearly understand net-zero carbon emissions and energy conservation sustainability. For colleagues in manufacturing units, AUO offers two types and more than 10 courses of energy-saving: basic and advanced applications. These courses cover topics such as clean room space structure and equipment operation principles, methods of electricity conservation, measurement and verification of energy-saving benefits, as well as the energy-saving principles and case studies of high-energy-consuming equipment (such as heaters and pumps), combining practical on-site practices to enhance energy-saving effectiveness. In 2023, the number of trainees exceeded 4,000 person-times.
AUO also promotes energy consumption reduction awareness through email or posters, encouraging practical energy efficiency behaviors. For example, promoting "Cool Business for Summer" encourages colleagues to choose lightweight, appropriate, and comfortable business attire to achieve energy consumption reduction by setting the office temperature appropriately and reducing air conditioning usage. Additionally, there are office energy consumption reduction tips, such as using stairs instead of elevators, setting computers to power-saving mode, and turning off power when leaving the office. AUO also organizes events such as "Green Knowledge+ Green Citizen Action" and "Energy-saving School" to invite employees to record and share their personal energy consumption reduction actions, thus strengthening and spreading energy consumption reduction awareness in their work and daily lives.
Scope 3 GHG emission


Greenhouse Gas Management Milestone

2020 Introduce ISO 14064-2018 and receive the certification, making AUO the first company in the display panel industry
Scope 3

2023
New inventory item
Downstream leasing and capital goods (11 items in total)

2021
New inventory item
Upstream leased assets (9 items in total)

2019
Develop systematic management of Value Chain Accounting (VCA) platform

2016~2018
New inventory item
raw materials of upstream and downstream transportation and purchase ( Total of 8 items )
2012~2015
New inventory item
waste, employee commuting, subsidiaries, fuel energy (Total of 5 items)
2010
Start the Scope 3 carbon inventory of the value chain
employee business Travel (Total of 1 item)
Scope 1&2

2012~Present
Participate in the promotion of all greenhouse gas projects of the Environmental Protection Administration
previous project verification, development of offset methodologies, and declaration operation of the Greenhouse Gas Reduction and Management Act

2020
Verified through the methodology of carbon emission rights substitution by the EPA

2010~2011
Organize audit and verification demonstration programs
Expand supplier audit scope
ECA platform systematic management

2007~2009
>Respond to CDP' s disclosure of the carbon management mechanism
Counsel the supply chain to introduce greenhouse gas inventory
2005~2006
Introduce ISO 14064-1 third party verification in 2005-2006, and obtaine declaration for all factory areas
2003
First year of greenhouse gas inventory
Historical GHG Emission
Scope 1
0.07 Million tones CO2e

Scope 2
2.12 Million tones CO2e

Scope 3
4.63 Million tones CO2e

Implementation Status
The Scope 3 target is set in line with the SBT scenario for reducing carbon emissions to keep global warming below 2°C. Using 2021 as the base year, the target is to achieve a 25% absolute reduction in emissions by 2030. Following this pathway, the Scope 3 target for 2024 is set at 4.86 million tons of carbon equivalent.
A
Applicable to AUO, and has been quantified
B
Applicable to AUO, and has not been quantified. AUO has plan or mgt. methods
C
Applicable to AUO, but there is no quantitative plan.
D
Not applicable to AUO
Purchased products and services
Using previous product carbon footprint inventory conducted by AUO as the basis to calculate the materials needed during production, main carbon emissions from the product raw materials stage are used as the reference for calculating this item. The item includes glass substrate, liquid crystal, photoresist, developer, etchant, array stripper and thinner. And added metal backplates, polarizers, and light guide plates for this fiscal year.
A
930,953.50 tones CO2e
Fuel and energy related activities
Calculate AUO's energy consumption including diesel, LPG, natural gas, and electricity, as well as calculate fuel energyrelated emissions using the energy resource cradle-to-gate coe cient announced by the EPA.
A
412424.88 tones CO2e
Wastes generated during the production process
Calculate GHG emissions generated during the nal waste shipping and treatment process including sludge waste, waste solvent, glass, acid, EAF dust, empty barrel and scrap metal. If the aforementioned items have not reached at least 80% of the total waste disposal volume, new items will be added to the calculation.
A
22,201.30 tones CO2e
Capital goods
AUO is reassessing the asset numbering establishment process, evaluating the feasibility of collecting carbon emission calculation information, and calculating the assets included in AUO's annual audit as of 2023 to be included in the scope 3 audit range.
A
463,972.76 tones CO2e
Upstream leased assets
AUO calculates energy consumed by our leased offices in Taiwan and abroad including diesel, LPG, natural gas, and electricity, as well as calculates fuel energy-related emissions using the energy resource cradle-to-gate coefficient announced by the EPA.
A
0 tones CO2e (There are no upstream leased assets related to this fiscal year)
Upstream transportation emissions
AUO calculates greenhouse gas emissions caused by transportation of direct materials purchased for production from supplier shipping locations (actual address or factory representative selected from the website) to the company's receiving locations, but excluding transportation between company sites. To improve scope 3 calculations, AUO has made changes to the calculation scope this year, expanding from only calculating emissions for 4 major material numbers to including upstream transportation of all direct materials purchased.
A
166,477.55 tones CO2e
Downstream transportation emissions
Products delivered by all the factories in the year (including the contractors' factories) are included in the calculation, but the transportation of front-end products to the OEM is excluded. GHG emissions are generated by land transport to the port or airport, or sea freight/air freight to the destination port/airport, but excluding transport between the factories and OEM factories.
A
13,920.46 tones CO2e
Business travel
Calculate the GHG emissions of AUO colleagues through the business trip travel system; the individual emissions will be calculated according to means of transportation applied for reimbursement including airplanes, high-speed rails, rental cars, self-owned cars, taxis, etc.
A
1,423.10 tones CO2e
Employee commuting
Calculate the GHG emissions of all employees in the plant, including direct employees and indirect employees. Commutations to and from work and shuttle buses between plant areas, the shuttle bus for foreign employees commuting to and from work are also included in the calculation.
A
17,537.92 tones CO2e
Investment process
Emission amounts for Scope 1 and Scope 2 of subsidiaries in which the company holds at least 50% equity, consolidated in the affiliated financial statements.
A
32,033.11 tones CO2e
Processing of products sold
Calculation scope is the products shipped from AUO manufacturing plants during the audit year, which are processed into final products at the customer’s site (to be included in 2024).
A
40,810.7 tones CO2e
Use of products sold
AUO operates as a B2B company, and its products are not end products. In this project, AUO recognizes that the main carbon emissions from the products come from the energy consumption of display modules. Therefore, the company has voluntarily estimated these emissions, provided them for stakeholders' reference, and included them in the SBT Scope 3 targets as a key area for carbon reduction.
Calculation scope is the IT panel module products shipped from AU Optronics manufacturing plants during the audit year, with estimated emissions during their usage phase.
A
2,422,521.74 tones CO2e
Final processing of products sold
AUO does not manufacture end products, therefore this item is not applicable.
D
Not applicable to AUO
Downstream leased assets
Clarify that AUO's leased assets primarily consist of office buildings. The calculation for this project involves the carbon emissions generated by tenants using AUO's assets.
A
106,758.04 tonne CO2e
Franchise
AUO has no franchise
D
Not applicable to AUO
Scope 1
0.07 Million tones CO2e
Scope 2
2.36 Million tones CO2e
Scope 3
4.93 Million tones CO2e
Implementation Status
The Scope 3 target is set in line with the SBT scenario for reducing carbon emissions to keep global warming below 2°C. Using 2021 as the base year, the target is to achieve a 25% absolute reduction in emissions by 2030. Following this pathway, the Scope 3 target for 2023 is set at 4.96 million tons of carbon equivalent.
A
Applicable to AUO, and has been quantified
B
Applicable to AUO, and has not been quantified. AUO has plan or mgt. methods
C
Applicable to AUO, but there is no quantitative plan.
D
Not applicable to AUO
Purchased products and services
Using previous product carbon footprint inventory conducted by AUO as the basis to calculate the materials needed during production, main carbon emissions from the product raw materials stage are used as the reference for calculating this item. The item includes glass substrate, liquid crystal, photoresist, developer, etchant, array stripper and thinner. And added metal backplates, polarizers, and light guide plates for this fiscal year.
A
825,778.96 tones CO2e
Fuel and energy related activities
Calculate AUO's energy consumption including diesel, LPG, natural gas, and electricity, as well as calculate fuel energyrelated emissions using the energy resource cradle-to-gate coe cient announced by the EPA.
A
447,726.93 tones CO2e
Wastes generated during the production process
Calculate GHG emissions generated during the nal waste shipping and treatment process including sludge waste, waste solvent, glass, acid, EAF dust, empty barrel and scrap metal. If the aforementioned items have not reached at least 80% of the total waste disposal volume, new items will be added to the calculation.
A
1,687.10 tones CO2e
Capital goods
AUO is reassessing the asset numbering establishment process, evaluating the feasibility of collecting carbon emission calculation information, and calculating the assets included in AUO's annual audit as of 2023 to be included in the scope 3 audit range.
A
163,597.90 tones CO2e
Upstream leased assets
AUO calculates energy consumed by our leased offices in Taiwan and abroad including diesel, LPG, natural gas, and electricity, as well as calculates fuel energy-related emissions using the energy resource cradle-to-gate coefficient announced by the EPA.
A
0 tones CO2e (AUO revised the audit boundary, and there are no upstream leased assets related to this fiscal year)
Upstream transportation emissions
AUO calculates greenhouse gas emissions caused by transportation of direct materials purchased for production from supplier shipping locations (actual address or factory representative selected from the website) to the company's receiving locations, but excluding transportation between company sites. To improve scope 3 calculations, AUO has made changes to the calculation scope this year, expanding from only calculating emissions for 4 major material numbers to including upstream transportation of all direct materials purchased.
A
639,882.00 tones CO2e
Downstream transportation emissions
Products delivered by all the factories in the year (including the contractors' factories) are included in the calculation, but the transportation of front-end products to the OEM is excluded. GHG emissions are generated by land transport to the port or airport, or sea freight/air freight to the destination port/airport, but excluding transport between the factories and OEM factories.
A
25,539.61 tones CO2e
Business travel
Calculate the GHG emissions of AUO colleagues through the business trip travel system; the individual emissions will be calculated according to means of transportation applied for reimbursement including airplanes, high-speed rails, rental cars, self-owned cars, taxis, etc.
A
978.92 tones CO2e
Employee commuting
Calculate the GHG emissions of all employees in the plant, including direct employees and indirect employees. Commutations to and from work and shuttle buses between plant areas, the shuttle bus for foreign employees commuting to and from work are also included in the calculation.
A
13,342.18 tones CO2e
Investment process
AUO Crystal Corp. is a wholly-owned manufacturing subsidiary of AUO. Since it conducts GHG inventory every year, its emissions are included in the calculations
A
37,174.04 tones CO2e
Processing of products sold
This item applies to AUO; however, since there is no relevant methodology and information collection platform at present, therefore, it is excluded according to the criteria for the significance of indirect emissions
C
Applicable to AUO, but there is no quantitative plan.
Use of products sold
AUO operates as a B2B company, and its products are not end products. In this project, AUO recognizes that the main carbon emissions from the products come from the energy consumption of display modules. Therefore, the company has voluntarily estimated these emissions, provided them for stakeholders' reference, and included them in the SBT Scope 3 targets as a key area for carbon reduction.
This item selected desktop monitors as the endpoint product for estimation and estimated the carbon emissions during the product lifecycle stage when AUO's panel modules are used in desktop monitors.
D
2758188.00 tones CO2e
Final processing of products sold
AUO does not manufacture end products, therefore this item is not applicable.
D
Not applicable to AUO
Downstream leased assets
Clarify that AUO's leased assets primarily consist of office buildings. The calculation for this project involves the carbon emissions generated by tenants using AUO's assets.
A
14,873.54 tonne CO2e
Franchise
AUO has no franchise
D
Not applicable to AUO
Scope 1
0.07 Million tones CO2e
Scope 2
2.37 Million tones CO2e
Scope 3
1.00 Million tones CO2e
Implementation Status
A
Applicable to AUO, and has been quantified
B
Applicable to AUO, and has not been quantified. AUO has plan or mgt. methods
C
Applicable to AUO, but there is no quantitative plan.
D
Not applicable to AUO
Purchased products and services
Using previous product carbon footprint inventory conducted by AUO as the basis to calculate the materials needed during production, main carbon emissions from the product raw materials stage are used as the reference for calculating this item. The item includes glass substrate, liquid crystal, photoresist, developer, etchant, array stripper and thinner, etc.
A
472,378.32 tones CO2e
Fuel and energy related activities
Calculate AUO's energy consumption including diesel, LPG, natural gas, and electricity, as well as calculate fuel energyrelated emissions using the energy resource cradle-to-gate coe cient announced by the EPA.
A
402,996.91 tones CO2e
Wastes generated during the production process
Calculate GHG emissions generated during the nal waste shipping and treatment process including sludge waste, waste solvent, glass, acid, EAF dust, empty barrel and scrap metal. If the aforementioned items have not reached at least 80% of the total waste disposal volume, new items will be added to the calculation.
A
18,126.84 tones CO2e
Capital goods
The company has not purchased a large amount of capital goods in recent years, and there is no quantitative plan for this project after evaluation.
C
Applicable to AUO, but there is no quantitative plan
Upstream leased assets
AUO calculates energy consumed by our leased offices in Taiwan and abroad including diesel, LPG, natural gas, and electricity, as well as calculates fuel energy-related emissions using the energy resource cradle-to-gate coefficient announced by the EPA.
A
242.72 tones CO2e
Upstream transportation emissions
Four major categories of materials needed for plant production are included in the calculation, these include glass, target materials, gas chemicals, etc. These will generate GHG emissions from the supplier's location (the actual address or a representative plant is selected from the website). Transportation between the Company's factories is not included in the calculation.
A
3,092.71 tones CO2e
Downstream transportation emissions
Products delivered by all the factories in the year (including the contractors' factories) are included in the calculation, but the transportation of front-end products to the OEM is excluded. GHG emissions are generated by land transport to the port or airport, or sea freight/air freight to the destination port/airport, but excluding transport between the factories and OEM factories.
A
31,004.97 tones CO2e
Business travel
Calculate the GHG emissions of AUO colleagues through the business trip travel system; the individual emissions will be calculated according to means of transportation applied for reimbursement including airplanes, high-speed rails, rental cars, self-owned cars, taxis, etc.
A
1,051.32 tones CO2e
Employee commuting
Calculate the GHG emissions of all employees in the plant, including direct employees and indirect employees. Commutations to and from work and shuttle buses between plant areas, the shuttle bus for foreign employees commuting to and from work are also included in the calculation.
A
21,764.02 tones CO2e
Investment process
AUO Crystal Corp. is a wholly-owned manufacturing subsidiary of AUO. Since it conducts GHG inventory every year, its emissions are included in the calculations
A
53,828.04 tones CO2e
Processing of products sold
This item applies to AUO; however, since there is no relevant methodology and information collection platform at present, therefore, it is excluded according to the criteria for the significance of indirect emissions
C
Applicable to AUO, but there is no quantitative plan.
Use of products sold
AUO is a B2B company and we do not manufacture end products, therefore this item is not applicable.
D
Not applicable to AUO
Final processing of products sold
AUO does not manufacture end products, therefore this item is not applicable.
D
Not applicable to AUO
Downstream leased assets
This item applies to AUO, and relevant protocols have been evaluated and formulated. It will be included in future calculations.
B
Applicable to AUO, and has not been quantified. AUO has plan or mgt. methods
Franchise
AUO has no franchise
D
Not applicable to AUO
Scope 1
0.08 Million tones CO2e
Scope 2
2.84 Million tones CO2e
Scope 3
1.29 Million tones CO2e
Implementation Status
A
Applicable to AUO, and has been quantified
B
Applicable to AUO, and has not been quantified. AUO has plan or mgt. methods
C
Applicable to AUO, but there is no quantitative plan.
D
Not applicable to AUO
Purchased goods and services
Using previous product carbon footprint audit conducted by AUO as the basis to calculate the materials needed during production. While the main carbon emissions during the product raw material stage are used as the reference for calculating this item. The item includes glass substrate, liquid crystal, photoresist, developer, etchant, array stripper and thinner, etc.
A
616395.10 tones CO2e
Capital goods
The company has not purchased a large amount of capital goods in recent years, and there is no quantitative plan for this project after evaluation.
C
Applicable to AUO, but there is no quantitative plan.
Fuel Energy Related(Non Scope 1 & 2)
Calculate AUO‘s energy consumption, including diesel, LPG, natural gas, electricity. Calculate fuel energy-related emissions resource with cradle-to-gate coefficient announced by the EPA.
A
479272.02 tones CO2e
Upstream transportation and distribution
Materials needed for factory production (63!、65!、67!、68!) are included in the calculation, these include glass, PI spacer, Target, gas chemicals, etc. These will generate GHG emissions from the supplier‘s location (actual address or a representative factory is selected from the website). Transportation between the Company's factories is not included in the calculation.
A
7972.00 tones CO2e
Waste generated in operations
Calculate GHG emissions generated during the final waste shipping and treatment process including sludge waste, waste solvent, glass, acid, EAF dust, empty barrel, and hardware. If the aforementioned items have not reached at least 80% of the total waste disposal volume, items will be added to the calculation.
A
25660.99 tones CO2e
Business travel
Calculate the greenhouse gas emissions of AUO colleagues through the business trip travel system; the individual emissions will be calculated according to means of transportation applied for reimbursement including airplanes, high-speed rails, rental cars, self-owned cars and taxis, etc.
A
869.04 tones CO2e
Employee commuting
Calculate the greenhouse gas emissions of all employees in the factory, including direct employees and indirect employee. Commutation to and from work and shuttle bus between factory areas, the shuttle bus for foreign nationality employees commuting to and from work are also included in the calculation.
A
38732.73 tones CO2e
Upstream leased assets
Calculate carbon emissions from energy use in domestic and foreign leasing offices from 2021.
A
168.63 tones CO2e
Investments
AUO Crystal Corp. is a wholly owned manufacturing subsidiary of AUO. Since it conducts GHG audit every year, its emissions is included in the calculations.
A
49729.23 tones CO2e
Downstream transportation and distribution
All products delivered by all the factories in the year (including the contractors‘ factories) are included in the calculation, but the transportation of front-end products to the OEM is excluded. GHG emissions are generated by land transport to the port or airport, or sea freight/air freight to the destination port/airport, but excluding transport between the factories and OEM factories.
A
67284.90 tones CO2e
Processing of sold products
This item is applicable to AUO; however, since there is no accurate and mature methodology and information collection method at the present time, therefore, it is excluded according to the indirect emission materiality standards.
C
Applicable to AUO, but there is no quantitative plan.
Use of sold products
AUO is a B2B company and we do not manufacture end products, therefore it does not apply to this item.
D
Not applicable to AUO
End-of-life treatment of sold products
This item applies to AUO, and relevant protocols have been evaluated and formulated. It will be included in future calculations.
D
Not applicable to AUO
Downstream leased assets
AUO is applicable to this project and has assessed and established a relevant methodology to be included in future calculations
B
Applicable to AUO, and has not been quantified. AUO has plan or mgt. methods
Franchises
D
Not applicable to AUO
Scope 1
0.10 Million tones CO2e
Scope 2
2.91 Million tones CO2e
Scope 3
1.47 Million tones CO2e
Implementation Status
A
Applicable to AUO, and has been quantified
B
Applicable to AUO, and has not been quantified. AUO has plan or mgt. methods
C
Applicable to AUO, but there is no quantitative plan.
D
Not applicable to AUO
Purchased goods and services
Using previous product carbon footprint audit conducted by AUO as the basis to calculate the materials needed during production. While the main carbon emissions during the product raw material stage are used as the reference for calculating this item. The item includes glass substrate, liquid crystal, photoresist, developer, etchant, array stripper and thinner, etc.
A
721696.535 tones CO2e
Capital goods
The company has not purchased a large amount of capital goods in recent years, and there is no quantitative plan for this project after evaluation.
C
Applicable to AUO, but there is no quantitative plan.
Fuel Energy Related(Non Scope 1 & 2)
Calculate AUO‘s energy consumption, including diesel, LPG, natural gas, electricity. Calculate fuel energy-related emissions resource with cradle-to-gate coefficient announced by the EPA.
A
572489.11 tones CO2e
Upstream transportation and distribution
Materials needed for factory production (63!、65!、67!、68!) are included in the calculation, these include glass, PI spacer, Target, gas chemicals, etc. These will generate GHG emissions from the supplier‘s location (actual address or a representative factory is selected from the website). Transportation between the Company's factories is not included in the calculation.
A
18665.52 tones CO2e
廢棄物處理
Waste generated in operations
A
19703.02 tones CO2e
Business travel
Calculate the greenhouse gas emissions of AUO colleagues through the business trip travel system; the individual emissions will be calculated according to means of transportation applied for reimbursement including airplanes, high-speed rails, rental cars, self-owned cars and taxis, etc.
A
909.46 tones CO2e
Employee commuting
Calculate the greenhouse gas emissions of all employees in the factory, including direct employees and indirect employee. Commutation to and from work and shuttle bus between factory areas, the shuttle bus for foreign nationality employees commuting to and from work are also included in the calculation.
A
47932.54 tones CO2e
Upstream leased assets
Calculate carbon emissions from energy use in domestic and foreign leasing offices from 2021.
B
Applicable to AUO, and has not been quantified. AUO has plan or mgt. methods
Investments
AUO Crystal Corp. is a wholly owned manufacturing subsidiary of AUO. Since it conducts GHG audit every year, its emissions is included in the calculations.
A
38578.99 tones CO2e
Downstream transportation and distribution
All products delivered by all the factories in the year (including the contractors‘ factories) are included in the calculation, but the transportation of front-end products to the OEM is excluded. GHG emissions are generated by land transport to the port or airport, or sea freight/air freight to the destination port/airport, but excluding transport between the factories and OEM factories.
A
51853.97 tones CO2e
Processing of sold products
This item is applicable to AUO; however, since there is no accurate and mature methodology and information collection method at the present time, therefore, it is excluded according to the indirect emission materiality standards.
C
Applicable to AUO, but there is no quantitative plan.
Use of sold products
AUO is a B2B company and we do not manufacture end products, therefore it does not apply to this item.
D
Not applicable to AUO
End-of-life treatment of sold products
This item applies to AUO, and relevant protocols have been evaluated and formulated. It will be included in future calculations.
D
Not applicable to AUO
Downstream leased assets
AUO is applicable to this project and has assessed and established a relevant methodology to be included in future calculations
B
Applicable to AUO, and has not been quantified. AUO has plan or mgt. methods
Franchises
D
Not applicable to AUO
Scope 1
0.1 Million tones CO2e
Scope 2
3.04 Million tones CO2e
Scope 3
15.22 Million tones CO2e
Implementation Status
A
Applicable to AUO, and has been quantified
B
Applicable to AUO, and has not been quantified. AUO has plan or mgt. methods
C
Applicable to AUO, but there is no quantitative plan.
D
Not applicable to AUO
Purchased goods and services
Using previous product carbon footprint audit conducted by AUO as the basis to calculate the materials needed during production. While the main carbon emissions during the product raw material stage are used as the reference for calculating this item. The item includes glass substrate, liquid crystal, photoresist, developer, etchant, array stripper and thinner, etc.
A
258205 tones CO2e
Capital goods
The company has not purchased a large amount of capital goods in recent years, and there is no quantitative plan for this project after evaluation.
C
Applicable to AUO, but there is no quantitative plan.
Fuel Energy Related(Non Scope 1 & 2)
Calculate AUO‘s energy consumption, including diesel, LPG, natural gas, electricity. Calculate fuel energy-related emissions resource with cradle-to-gate coefficient announced by the EPA.
A
619 tones CO2e
Upstream transportation and distribution
Materials needed for factory production (63!、65!、67!、68!) are included in the calculation, these include glass, PI spacer, Target, gas chemicals, etc. These will generate GHG emissions from the supplier‘s location (actual address or a representative factory is selected from the website). Transportation between the Company's factories is not included in the calculation.
A
13455 tones CO2e
Waste generated in operations
Calculate GHG emissions generated during the final waste shipping and treatment process including sludge waste, waste solvent, glass, acid, EAF dust, empty barrel, and hardware. If the aforementioned items have not reached at least 80% of the total waste disposal volume, items will be added to the calculation.
A
7574 tones CO2e
Business travel
Calculate the greenhouse gas emissions of AUO colleagues through the business trip travel system; the individual emissions will be calculated according to means of transportation applied for reimbursement including airplanes, high-speed rails, rental cars, self-owned cars and taxis, etc.
A
1025 tones CO2e
Employee commuting
Calculate the greenhouse gas emissions of all employees in the factory, including direct employees and indirect employee. Commutation to and from work and shuttle bus between factory areas, the shuttle bus for foreign nationality employees commuting to and from work are also included in the calculation.
A
16956 tones CO2e
Upstream leased assets
Calculate carbon emissions from energy use in domestic and foreign leasing offices from 2021.
C
No plans to quantify
Investments
AUO Crystal Corp. is a wholly owned manufacturing subsidiary of AUO. Since it conducts GHG audit every year, its emissions is included in the calculations.
A
125768 tones CO2e
Downstream transportation and distribution
All products delivered by all the factories in the year (including the contractors‘ factories) are included in the calculation, but the transportation of front-end products to the OEM is excluded. GHG emissions are generated by land transport to the port or airport, or sea freight/air freight to the destination port/airport, but excluding transport between the factories and OEM factories.
A
55595 tones CO2e
Processing of sold products
This item is applicable to AUO; however, since there is no accurate and mature methodology and information collection method at the present time, therefore, it is excluded according to the indirect emission materiality standards.
C
Applicable to AUO, but there is no quantitative plan.
Use of sold products
AUO is a B2B company and we do not manufacture end products, therefore it does not apply to this item.
D
14742004 tones CO2e
End-of-life treatment of sold products
This item applies to AUO, and relevant protocols have been evaluated and formulated. It will be included in future calculations.
D
Not applicable to AUO
Downstream leased assets
AUO is applicable to this project and has assessed and established a relevant methodology to be included in future calculations
B
Applicable to AUO, and has not been quantified. AUO has plan or mgt. methods
Franchises
D
Not applicable to AUO
Scope 1
0.32 Million tones CO2e
Scope 2
3.25 Million tones CO2e
Scope 3
8.25 Million tones CO2e
Implementation Status
A
Applicable to AUO, and has been quantified
B
Applicable to AUO, and has not been quantified. AUO has plan or mgt. methods
C
Applicable to AUO, but there is no quantitative plan.
D
Not applicable to AUO
Purchased goods and services
Using previous product carbon footprint audit conducted by AUO as the basis to calculate the materials needed during production. While the main carbon emissions during the product raw material stage are used as the reference for calculating this item. The item includes glass substrate, liquid crystal, photoresist, developer, etchant, array stripper and thinner, etc.
A
362028 tones CO2e
Capital goods
The company has not purchased a large amount of capital goods in recent years, and there is no quantitative plan for this project after evaluation.
C
Applicable to AUO, but there is no quantitative plan.
Fuel Energy Related(Non Scope 1 & 2)
Calculate AUO‘s energy consumption, including diesel, LPG, natural gas, electricity. Calculate fuel energy-related emissions resource with cradle-to-gate coefficient announced by the EPA.
A
608 tones CO2e
Upstream transportation and distribution
Materials needed for factory production (63!、65!、67!、68!) are included in the calculation, these include glass, PI spacer, Target, gas chemicals, etc. These will generate GHG emissions from the supplier‘s location (actual address or a representative factory is selected from the website). Transportation between the Company's factories is not included in the calculation.
A
3717 tones CO2e
Waste generated in operations
Calculate GHG emissions generated during the final waste shipping and treatment process including sludge waste, waste solvent, glass, acid, EAF dust, empty barrel, and hardware. If the aforementioned items have not reached at least 80% of the total waste disposal volume, items will be added to the calculation.
A
12042 tones CO2e
Business travel
Calculate the greenhouse gas emissions of AUO colleagues through the business trip travel system; the individual emissions will be calculated according to means of transportation applied for reimbursement including airplanes, high-speed rails, rental cars, self-owned cars and taxis, etc.
A
756 tones CO2e
Employee commuting
Calculate the greenhouse gas emissions of all employees in the factory, including direct employees and indirect employee. Commutation to and from work and shuttle bus between factory areas, the shuttle bus for foreign nationality employees commuting to and from work are also included in the calculation.
A
20207 tones CO2e
Upstream leased assets
Calculate carbon emissions from energy use in domestic and foreign leasing offices from 2021.
C
No plans to quantify
Investments
AUO Crystal Corp. is a wholly owned manufacturing subsidiary of AUO. Since it conducts GHG audit every year, its emissions is included in the calculations.
A
143411 tones CO2e
Downstream transportation and distribution
All products delivered by all the factories in the year (including the contractors‘ factories) are included in the calculation, but the transportation of front-end products to the OEM is excluded. GHG emissions are generated by land transport to the port or airport, or sea freight/air freight to the destination port/airport, but excluding transport between the factories and OEM factories.
A
69525 tones CO2e
Processing of sold products
This item is applicable to AUO; however, since there is no accurate and mature methodology and information collection method at the present time, therefore, it is excluded according to the indirect emission materiality standards.
C
Applicable to AUO, but there is no quantitative plan.
Use of sold products
AUO is a B2B company and we do not manufacture end products, therefore it does not apply to this item.
D
7641475 tones CO2e
End-of-life treatment of sold products
This item applies to AUO, and relevant protocols have been evaluated and formulated. It will be included in future calculations.
D
Not applicable to AUO
Downstream leased assets
AUO is applicable to this project and has assessed and established a relevant methodology to be included in future calculations
B
Applicable to AUO, and has not been quantified. AUO has plan or mgt. methods
Franchises
D
Not applicable to AUO
Scope 1
0.32 Million tones CO2e
Scope 2
3.04 Million tones CO2e
Scope 3
1.73 Million tones CO2e
Implementation Status
A
Applicable to AUO, and has been quantified
B
Applicable to AUO, and has not been quantified. AUO has plan or mgt. methods
C
Applicable to AUO, but there is no quantitative plan.
D
Not applicable to AUO
Purchased goods and services
Using previous product carbon footprint audit conducted by AUO as the basis to calculate the materials needed during production. While the main carbon emissions during the product raw material stage are used as the reference for calculating this item. The item includes glass substrate, liquid crystal, photoresist, developer, etchant, array stripper and thinner, etc.
A
287987 tones CO2e
Capital goods
The company has not purchased a large amount of capital goods in recent years, and there is no quantitative plan for this project after evaluation.
C
Applicable to AUO, but there is no quantitative plan.
Fuel Energy Related(Non Scope 1 & 2)
Calculate AUO‘s energy consumption, including diesel, LPG, natural gas, electricity. Calculate fuel energy-related emissions resource with cradle-to-gate coefficient announced by the EPA.
A
648 tones CO2e
Upstream transportation and distribution
Materials needed for factory production (63!、65!、67!、68!) are included in the calculation, these include glass, PI spacer, Target, gas chemicals, etc. These will generate GHG emissions from the supplier‘s location (actual address or a representative factory is selected from the website). Transportation between the Company's factories is not included in the calculation.
A
3340 tones CO2e
Waste generated in operations
Calculate GHG emissions generated during the final waste shipping and treatment process including sludge waste, waste solvent, glass, acid, EAF dust, empty barrel, and hardware. If the aforementioned items have not reached at least 80% of the total waste disposal volume, items will be added to the calculation.
A
2943 tones CO2e
Business travel
Calculate the greenhouse gas emissions of AUO colleagues through the business trip travel system; the individual emissions will be calculated according to means of transportation applied for reimbursement including airplanes, high-speed rails, rental cars, self-owned cars and taxis, etc.
A
614 tones CO2e
Employee commuting
Calculate the greenhouse gas emissions of all employees in the factory, including direct employees and indirect employee. Commutation to and from work and shuttle bus between factory areas, the shuttle bus for foreign nationality employees commuting to and from work are also included in the calculation.
A
21154 tones CO2e
Upstream leased assets
Calculate carbon emissions from energy use in domestic and foreign leasing offices from 2021.
C
No plans to quantify
Investments
AUO Crystal Corp. is a wholly owned manufacturing subsidiary of AUO. Since it conducts GHG audit every year, its emissions is included in the calculations.
A
188181 tones CO2e
Downstream transportation and distribution
All products delivered by all the factories in the year (including the contractors‘ factories) are included in the calculation, but the transportation of front-end products to the OEM is excluded. GHG emissions are generated by land transport to the port or airport, or sea freight/air freight to the destination port/airport, but excluding transport between the factories and OEM factories.
B
Applicable to AUO, and has not been quantified. AUO has plan or mgt. methods
Processing of sold products
This item is applicable to AUO; however, since there is no accurate and mature methodology and information collection method at the present time, therefore, it is excluded according to the indirect emission materiality standards.
C
Applicable to AUO, but there is no quantitative plan.
Use of sold products
AUO is a B2B company and we do not manufacture end products, therefore it does not apply to this item.
D
1225409 tones CO2e
End-of-life treatment of sold products
This item applies to AUO, and relevant protocols have been evaluated and formulated. It will be included in future calculations.
D
Not applicable to AUO
Downstream leased assets
AUO is applicable to this project and has assessed and established a relevant methodology to be included in future calculations
B
Applicable to AUO, and has not been quantified. AUO has plan or mgt. methods
Franchises
D
Not applicable to AUO
Scope 1
0.26 Million tones CO2e
Scope 2
2.73 Million tones CO2e
Scope 3
1.63 Million tones CO2e
Implementation Status
A
Applicable to AUO, and has been quantified
B
Applicable to AUO, and has not been quantified. AUO has plan or mgt. methods
C
Applicable to AUO, but there is no quantitative plan.
D
Not applicable to AUO
Purchased goods and services
Using previous product carbon footprint audit conducted by AUO as the basis to calculate the materials needed during production. While the main carbon emissions during the product raw material stage are used as the reference for calculating this item. The item includes glass substrate, liquid crystal, photoresist, developer, etchant, array stripper and thinner, etc.
A
121639 tones CO2e
Capital goods
The company has not purchased a large amount of capital goods in recent years, and there is no quantitative plan for this project after evaluation.
C
Applicable to AUO, but there is no quantitative plan.
Fuel Energy Related(Non Scope 1 & 2)
Calculate AUO‘s energy consumption, including diesel, LPG, natural gas, electricity. Calculate fuel energy-related emissions resource with cradle-to-gate coefficient announced by the EPA.
A
520 tones CO2e
Upstream transportation and distribution
Materials needed for factory production (63!、65!、67!、68!) are included in the calculation, these include glass, PI spacer, Target, gas chemicals, etc. These will generate GHG emissions from the supplier‘s location (actual address or a representative factory is selected from the website). Transportation between the Company's factories is not included in the calculation.
B
Applicable to AUO, and has not been quantified. AUO has plan or mgt. methods
Waste generated in operations
Calculate GHG emissions generated during the final waste shipping and treatment process including sludge waste, waste solvent, glass, acid, EAF dust, empty barrel, and hardware. If the aforementioned items have not reached at least 80% of the total waste disposal volume, items will be added to the calculation.
A
21973 tones CO2e
Business travel
Calculate the greenhouse gas emissions of AUO colleagues through the business trip travel system; the individual emissions will be calculated according to means of transportation applied for reimbursement including airplanes, high-speed rails, rental cars, self-owned cars and taxis, etc.
A
1047 tones CO2e
Employee commuting
Calculate the greenhouse gas emissions of all employees in the factory, including direct employees and indirect employee. Commutation to and from work and shuttle bus between factory areas, the shuttle bus for foreign nationality employees commuting to and from work are also included in the calculation.
A
19387 tones CO2e
Upstream leased assets
Calculate carbon emissions from energy use in domestic and foreign leasing offices from 2021.
C
No plans to quantify
Investments
AUO Crystal Corp. is a wholly owned manufacturing subsidiary of AUO. Since it conducts GHG audit every year, its emissions is included in the calculations.
A
203220 tones CO2e
Downstream transportation and distribution
All products delivered by all the factories in the year (including the contractors‘ factories) are included in the calculation, but the transportation of front-end products to the OEM is excluded. GHG emissions are generated by land transport to the port or airport, or sea freight/air freight to the destination port/airport, but excluding transport between the factories and OEM factories.
C
No plans to quantify
Processing of sold products
This item is applicable to AUO; however, since there is no accurate and mature methodology and information collection method at the present time, therefore, it is excluded according to the indirect emission materiality standards.
C
Applicable to AUO, but there is no quantitative plan.
Use of sold products
AUO is a B2B company and we do not manufacture end products, therefore it does not apply to this item.
D
1269392 tones CO2e
End-of-life treatment of sold products
This item applies to AUO, and relevant protocols have been evaluated and formulated. It will be included in future calculations.
D
Not applicable to AUO
Downstream leased assets
AUO is applicable to this project and has assessed and established a relevant methodology to be included in future calculations
B
Applicable to AUO, and has not been quantified. AUO has plan or mgt. methods
Franchises
D
Not applicable to AUO
Scope 1
0.31 Million tones CO2e
Scope 2
2.47 Million tones CO2e
Scope 3
1.27 Million tones CO2e
Implementation Status
A
Applicable to AUO, and has been quantified
B
Applicable to AUO, and has not been quantified. AUO has plan or mgt. methods
C
Applicable to AUO, but there is no quantitative plan.
D
Not applicable to AUO
Purchased goods and services
Using previous product carbon footprint audit conducted by AUO as the basis to calculate the materials needed during production. While the main carbon emissions during the product raw material stage are used as the reference for calculating this item. The item includes glass substrate, liquid crystal, photoresist, developer, etchant, array stripper and thinner, etc.
No plans to quantify
Capital goods
The company has not purchased a large amount of capital goods in recent years, and there is no quantitative plan for this project after evaluation.
C
Applicable to AUO, but there is no quantitative plan.
Fuel Energy Related(Non Scope 1 & 2)
Calculate AUO‘s energy consumption, including diesel, LPG, natural gas, electricity. Calculate fuel energy-related emissions resource with cradle-to-gate coefficient announced by the EPA.
A
549 tones CO2e
Upstream transportation and distribution
Materials needed for factory production (63!、65!、67!、68!) are included in the calculation, these include glass, PI spacer, Target, gas chemicals, etc. These will generate GHG emissions from the supplier‘s location (actual address or a representative factory is selected from the website). Transportation between the Company's factories is not included in the calculation.
C
No plans to quantify
Waste generated in operations
Calculate GHG emissions generated during the final waste shipping and treatment process including sludge waste, waste solvent, glass, acid, EAF dust, empty barrel, and hardware. If the aforementioned items have not reached at least 80% of the total waste disposal volume, items will be added to the calculation.
A
25089 tones CO2e
Business travel
Calculate the greenhouse gas emissions of AUO colleagues through the business trip travel system; the individual emissions will be calculated according to means of transportation applied for reimbursement including airplanes, high-speed rails, rental cars, self-owned cars and taxis, etc.
A
1732 tones CO2e
Employee commuting
Calculate the greenhouse gas emissions of all employees in the factory, including direct employees and indirect employee. Commutation to and from work and shuttle bus between factory areas, the shuttle bus for foreign nationality employees commuting to and from work are also included in the calculation.
A
15850 tones CO2e
Upstream leased assets
Calculate carbon emissions from energy use in domestic and foreign leasing offices from 2021.
C
No plans to quantify
Investments
AUO Crystal Corp. is a wholly owned manufacturing subsidiary of AUO. Since it conducts GHG audit every year, its emissions is included in the calculations.
A
321451 tones CO2e
Downstream transportation and distribution
All products delivered by all the factories in the year (including the contractors‘ factories) are included in the calculation, but the transportation of front-end products to the OEM is excluded. GHG emissions are generated by land transport to the port or airport, or sea freight/air freight to the destination port/airport, but excluding transport between the factories and OEM factories.
C
No plans to quantify
Processing of sold products
This item is applicable to AUO; however, since there is no accurate and mature methodology and information collection method at the present time, therefore, it is excluded according to the indirect emission materiality standards.
C
Applicable to AUO, but there is no quantitative plan.
Use of sold products
AUO is a B2B company and we do not manufacture end products, therefore it does not apply to this item.
906133 tones CO2e
End-of-life treatment of sold products
This item applies to AUO, and relevant protocols have been evaluated and formulated. It will be included in future calculations.
D
Not applicable to AUO
Downstream leased assets
AUO is applicable to this project and has assessed and established a relevant methodology to be included in future calculations
B
Applicable to AUO, and has not been quantified. AUO has plan or mgt. methods
Franchises
D
Not applicable to AUO
Scope 1
0.34 Million tones CO2e
Scope 2
2.49 Million tones CO2e
Scope 3
0.21 Million tones CO2e
Implementation Status
A
Applicable to AUO, and has been quantified
B
Applicable to AUO, and has not been quantified. AUO has plan or mgt. methods
C
Applicable to AUO, but there is no quantitative plan.
D
Not applicable to AUO
Purchased goods and services
Using previous product carbon footprint audit conducted by AUO as the basis to calculate the materials needed during production. While the main carbon emissions during the product raw material stage are used as the reference for calculating this item. The item includes glass substrate, liquid crystal, photoresist, developer, etchant, array stripper and thinner, etc.
No plans to quantify
Capital goods
The company has not purchased a large amount of capital goods in recent years, and there is no quantitative plan for this project after evaluation.
C
Applicable to AUO, but there is no quantitative plan.
Fuel Energy Related(Non Scope 1 & 2)
Calculate AUO‘s energy consumption, including diesel, LPG, natural gas, electricity. Calculate fuel energy-related emissions resource with cradle-to-gate coefficient announced by the EPA.
A
514 tones CO2e
Upstream transportation and distribution
Materials needed for factory production (63!、65!、67!、68!) are included in the calculation, these include glass, PI spacer, Target, gas chemicals, etc. These will generate GHG emissions from the supplier‘s location (actual address or a representative factory is selected from the website). Transportation between the Company's factories is not included in the calculation.
C
No plans to quantify
Waste generated in operations
Calculate GHG emissions generated during the final waste shipping and treatment process including sludge waste, waste solvent, glass, acid, EAF dust, empty barrel, and hardware. If the aforementioned items have not reached at least 80% of the total waste disposal volume, items will be added to the calculation.
A
32468 tones CO2e
Business travel
Calculate the greenhouse gas emissions of AUO colleagues through the business trip travel system; the individual emissions will be calculated according to means of transportation applied for reimbursement including airplanes, high-speed rails, rental cars, self-owned cars and taxis, etc.
A
1796 tones CO2e
Employee commuting
Calculate the greenhouse gas emissions of all employees in the factory, including direct employees and indirect employee. Commutation to and from work and shuttle bus between factory areas, the shuttle bus for foreign nationality employees commuting to and from work are also included in the calculation.
A
19438 tones CO2e
Upstream leased assets
Calculate carbon emissions from energy use in domestic and foreign leasing offices from 2021.
C
No plans to quantify
Investments
AUO Crystal Corp. is a wholly owned manufacturing subsidiary of AUO. Since it conducts GHG audit every year, its emissions is included in the calculations.
A
163529 tones CO2e
Downstream transportation and distribution
All products delivered by all the factories in the year (including the contractors‘ factories) are included in the calculation, but the transportation of front-end products to the OEM is excluded. GHG emissions are generated by land transport to the port or airport, or sea freight/air freight to the destination port/airport, but excluding transport between the factories and OEM factories.
C
No plans to quantify
Processing of sold products
This item is applicable to AUO; however, since there is no accurate and mature methodology and information collection method at the present time, therefore, it is excluded according to the indirect emission materiality standards.
C
Applicable to AUO, but there is no quantitative plan.
Use of sold products
AUO is a B2B company and we do not manufacture end products, therefore it does not apply to this item.
B
Applicable to AUO, and has not been quantified. AUO has plan or mgt. methods
End-of-life treatment of sold products
This item applies to AUO, and relevant protocols have been evaluated and formulated. It will be included in future calculations.
D
Not applicable to AUO
Downstream leased assets
AUO is applicable to this project and has assessed and established a relevant methodology to be included in future calculations
B
Applicable to AUO, and has not been quantified. AUO has plan or mgt. methods
Franchises
D
Not applicable to AUO